> ## Documentation Index
> Fetch the complete documentation index at: https://fillout-005a867b-dependabot-npm-and-yarn-form-data-4-0-6.mintlify.site/llms.txt
> Use this file to discover all available pages before exploring further.
# Form Results Summary
> Get a quick and comprehensive overview of all your form responses. Visualize submissions as pie charts or bar charts and print the summary.
## How to view summary
Click `Results` on top followed by `Summary`. Answers are sorted by recency, with the most recent answers at the top.
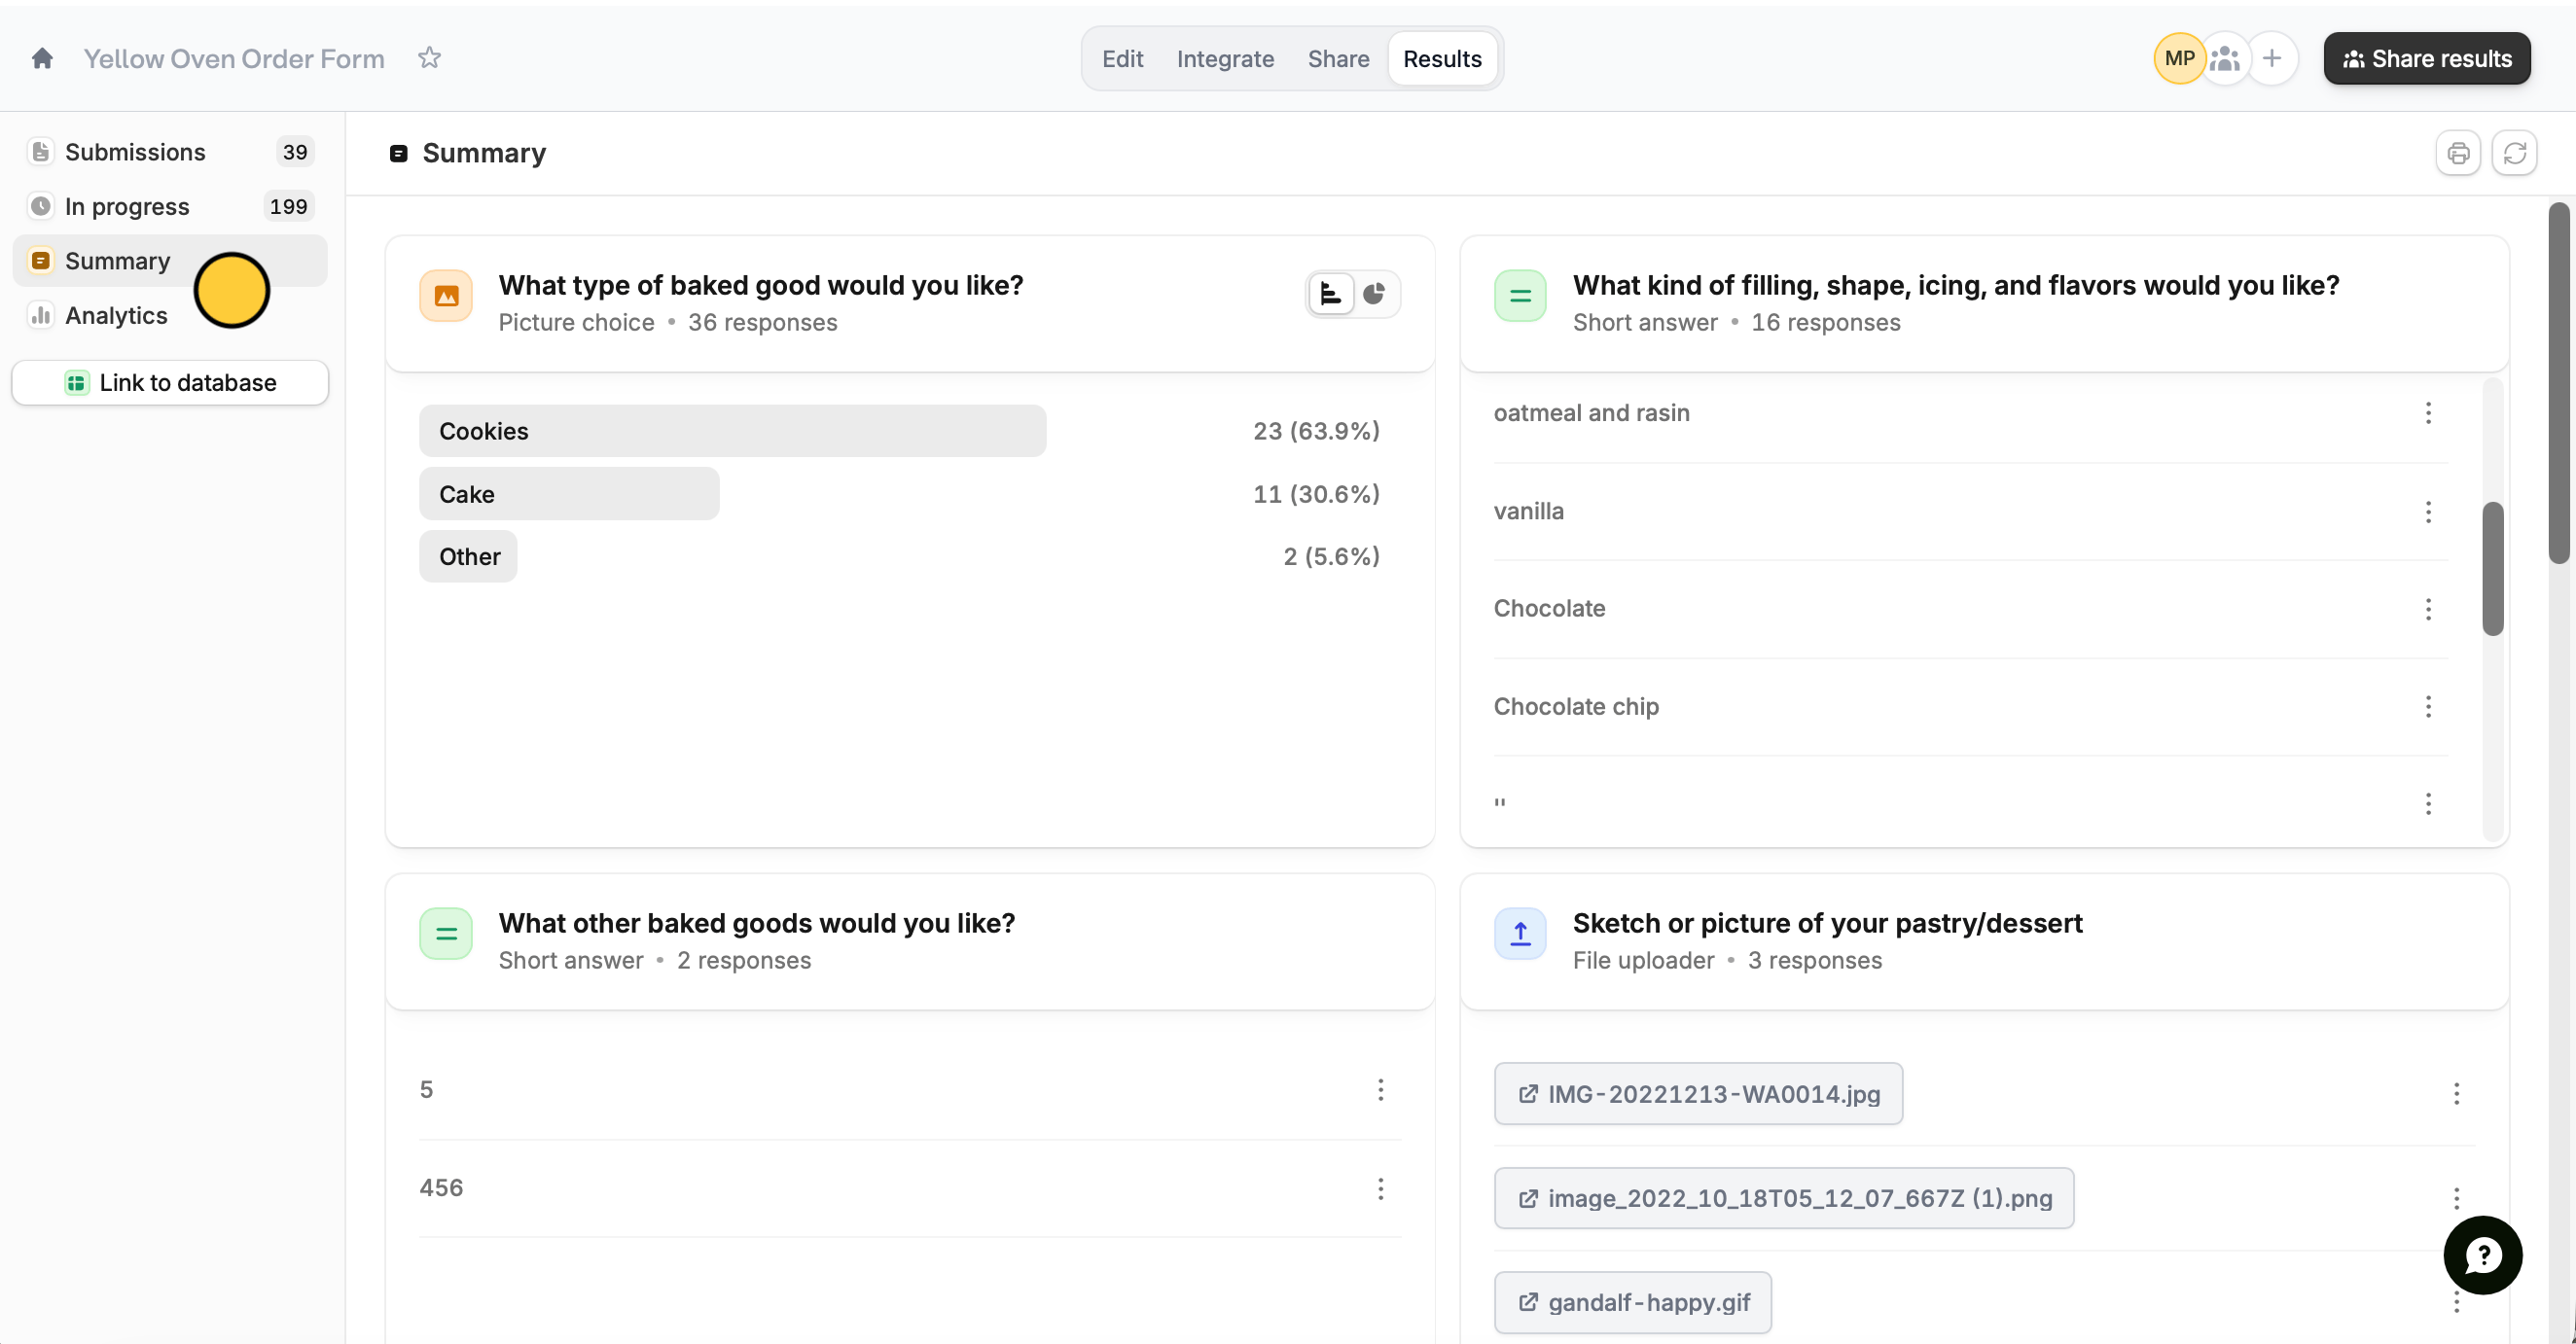 The summary is only generated from the latest 5,000 responses. Older submissions are excluded.
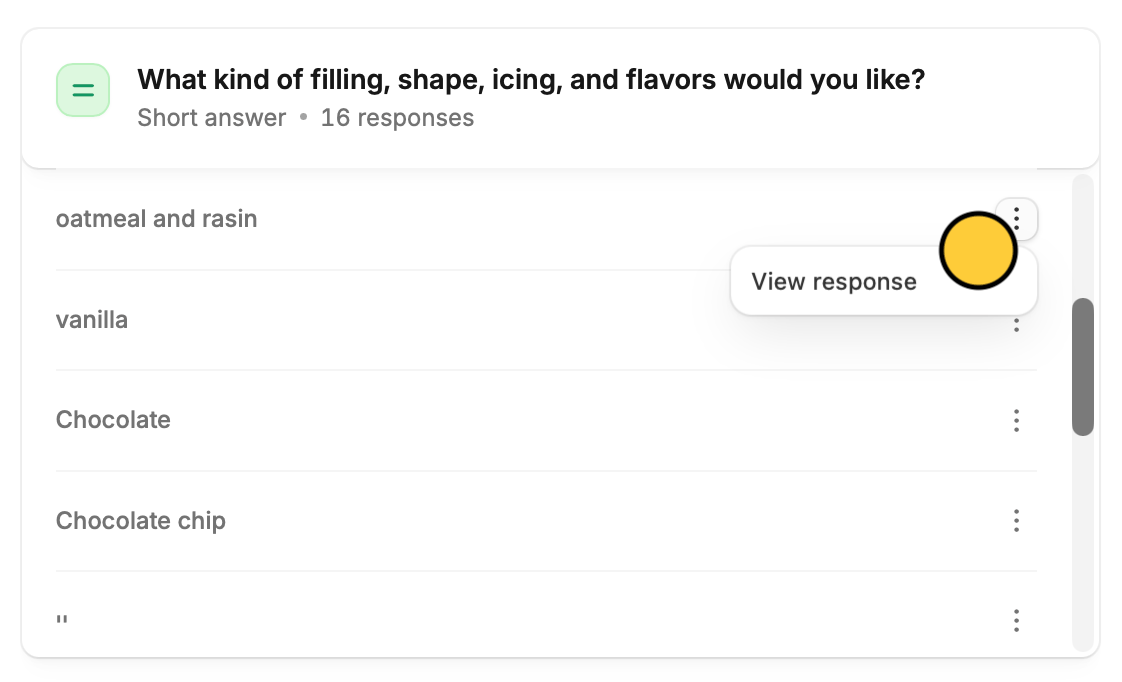
If an answer catches your interest and you want to see the respondent's full submission, click to `View response`.
The summary is only generated from the latest 5,000 responses. Older submissions are excluded.
If an answer catches your interest and you want to see the respondent's full submission, click to `View response`.
 The right-hand panel will show you answers to other questions. You'll also see submission details at the bottom like what type of browser they used and when they submitted your form.
## Visualize your data
Fillout helps you spot trends across your survey results. Choice questions are summarized with a bar chart. Change the view by clicking .
The right-hand panel will show you answers to other questions. You'll also see submission details at the bottom like what type of browser they used and when they submitted your form.
## Visualize your data
Fillout helps you spot trends across your survey results. Choice questions are summarized with a bar chart. Change the view by clicking .
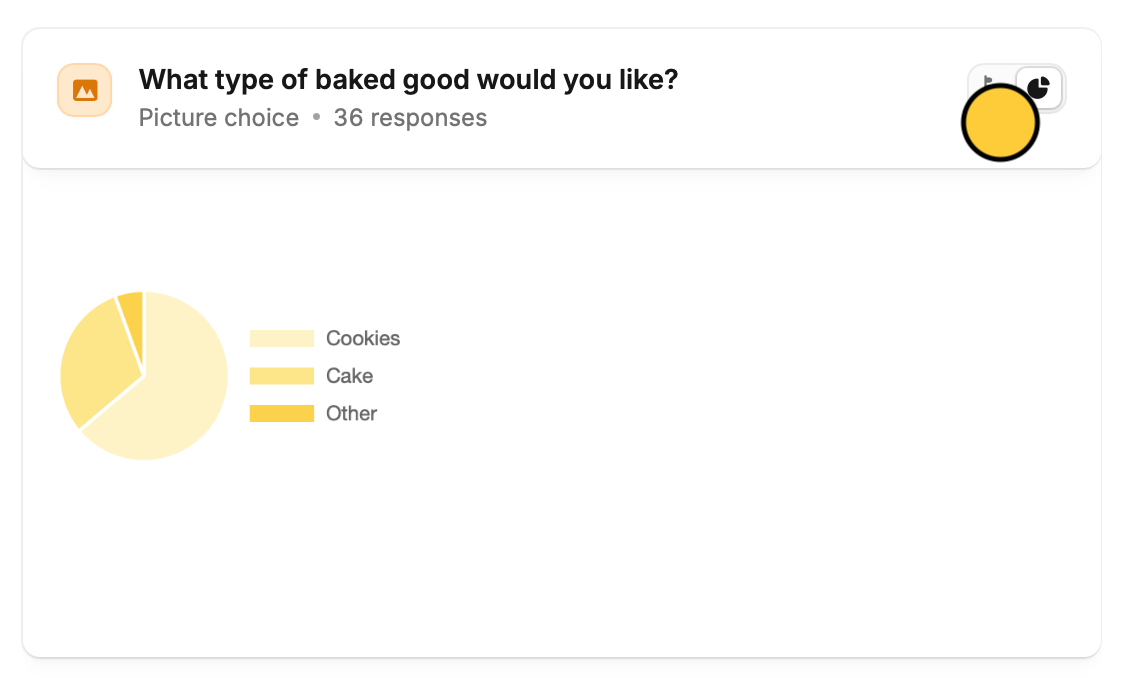 For performance and readability, the pie chart toggle is only available for choice questions with 200 options or fewer and text questions with 20 or fewer unique responses.
## Print summary
Simply click on the top right to get a hard copy of the summary.
## Related articles
Auto-save progress so respondents can resume later.
View all submissions to your form. Filter, sort, or export to CSV.
Remove duplicates, and other unnecessary entries.
For performance and readability, the pie chart toggle is only available for choice questions with 200 options or fewer and text questions with 20 or fewer unique responses.
## Print summary
Simply click on the top right to get a hard copy of the summary.
## Related articles
Auto-save progress so respondents can resume later.
View all submissions to your form. Filter, sort, or export to CSV.
Remove duplicates, and other unnecessary entries.